Display Web
Visualization on webpage through WiFi
websocket
[x] Raw data multicast
[ ] Authentication before accessing websocket
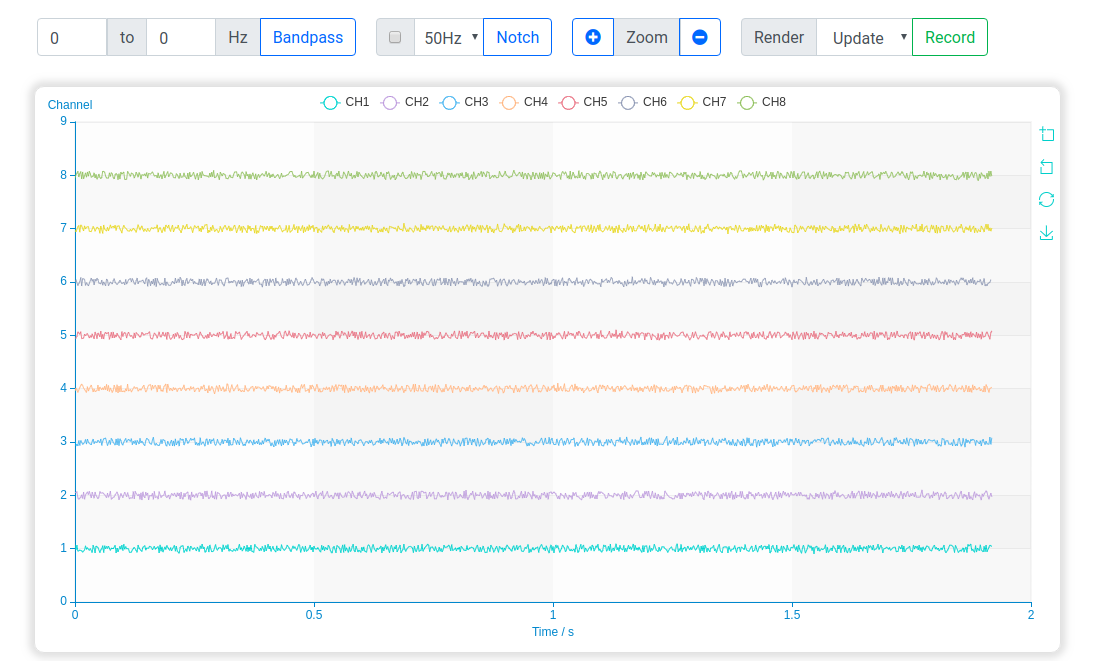
visualization
[x] Display 8-chs signal simultaneously in single chart
[x] Hide or show each channel
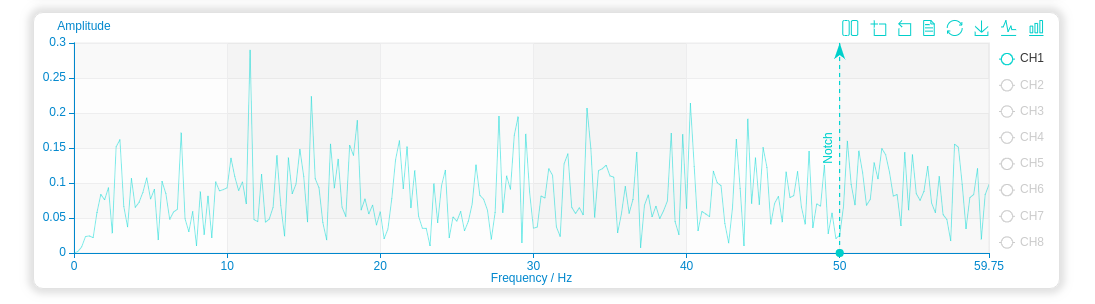
[ ] Adjust frequency domain amp and range
[x] Generate resource and protect it behind a token
configs
[x] Realtime data status
[x] Parameters setting